National Accounts (GDP)
Gross Domestic Product 2025
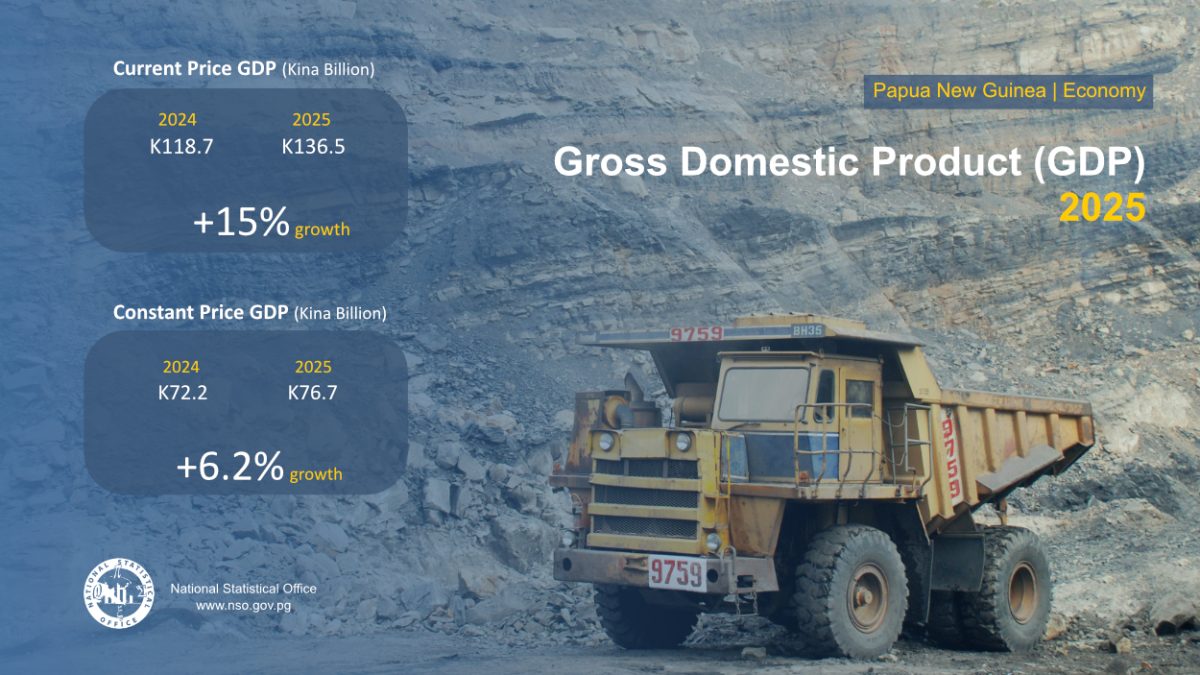
Papua New Guinea’s economy grew 6.2% in real terms in 2025, with current price GDP up 15% to K136.5 billion, driven by agriculture and mining.
2025 Papua New Guinea Gross Domestic Product (GDP)
2025 GDP grew by 15% or K18 billion.
The 2025 GDP Current Price growth of 15% was due to the impact of price increases (up 8.4%) and production increases (up 6.2%).
Summary Commentary
1. Key 2025 GDP results, Kina
| Measure | Unit | 2024 | 2025 | Growth |
|---|---|---|---|---|
| Current Price GDP | Kina billion | K118.7 | K136.5 | +15.0% |
| Constant Price GDP | Kina billion | K 72.2 | K 76.7 | +6.2% |
| Current Price GDP per capita | Kina per person | K 11,652 | K 13,055 | +12.0% |
2. Current price GDP
Current price GDP (Nominal GDP) measures the total Kina value of goods and services produced in PNG at the prices of the reporting period. Changes in both prices and production quantities therefore affect current price GDP.
In 2025, current price GDP grew by 15.0%, increasing from K118.7 billion in 2024 to K136.5 billion in 2025.
The Current Price growth was due to the additive impact of price increases (up 8.4%) and production increases (up 6.2%).
3. Constant price GDP
Constant price GDP (Real GDP) measures the total value of goods and services produced in PNG using constant 2013 prices. Consequently, changes in production quantities are reflected in constant price GDP, while changes in prices are excluded.
Constant price GDP increased by 6.2% in 2025, from K72.2 billion in 2024 to K76.7 billion in 2025.
Increased production quantities in Agriculture and Mining where the drivers of this growth.
4. GDP per capita
GDP per capita is an economic measure that divides total GDP by population and indicates average Kina value of economic production per person.
Current price GDP per capita increased by 12.0% in 2025, from K11,652 in 2024 to K13,055 in 2025.
The 12.0% increase reflected 15.0% growth in current price GDP together with a 2.6% increase in population.
5. Key drivers of 2025 Current Price GDP, levels and growth
Current price GDP was approximately K18 billion higher in 2025 than in 2024. The following industries as the largest contributors to this increase:
| Industry | 2024 (K billions) | 2025 (K billions) | Growth (levels) | Growth (%) |
|---|---|---|---|---|
| Mining | K 20.2 | K23.9 | +9.1 | +27.0% |
| Agriculture, Forestry & Fishing | K 32.7 | K41.8 | +3.7 | +18.3% |
| Wholesale & Retail Trade | K 11.2 | K12.0 | +0.8 | +7.4% |
Together, these three industries account for K13.6 billion of the approximately K18 billion increase in the 2025 Current Price GDP.
6. Economic Review from base year, 2013 to 2025
GDP at Constant Price
Between 2013 and 2025, PNG’s Constant Price GDP increased by K29.0 billion, (+60.6%), mainly driven by strong growth in Oil & Gas production.
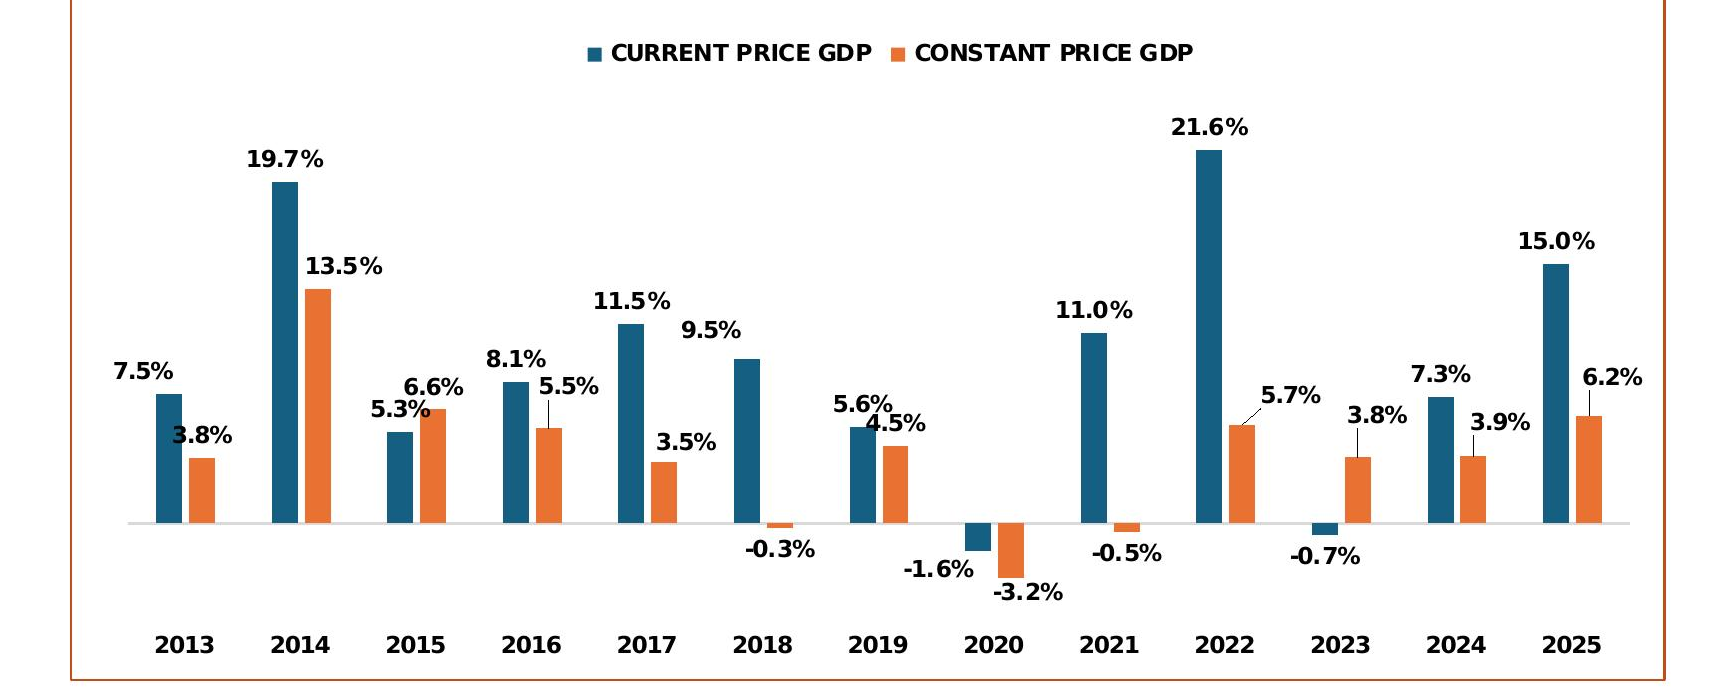 Over the same period, Gross Value Added (GVA) at basic prices increased by K26.98 billion, comprising K13.50 billion from mineral industries and K13.48 billion from non-mineral industries. Agriculture, Public Administration, and Information & Communication were the main drivers of non-mineral growth.
GDP growth varied over the period, with contractions recorded in 2018, 2020 and 2021. The contraction in 2018 reflected a decline in Oil & Gas production, while the contractions in 2020 and 2021 reflected the impacts of COVID-19.
For further information, visit www.nso.gov.pg.