
Censuses & surveys
Socio-Demographic and Economic Survey (SDES)
The 2022 SDES: population estimates, demographic characteristics, functional difficulty, education, labour force, fertility, migration and housing.
What is Socio-Demographic and Economic Survey (SDES)?
Nationally representative household survey designed to provide information on population, migration, education, labour and employment, fertility, disability, household, and housing characteristics
Objectives
-
to generate essential key indicators as inputs in the preparation of national plans and programs for the well-being of the population
-
to monitor the progress of development programs as stipulated in the Sustainable Development Goals (SDGs), Medium Term Development Plans, Vision 2050 and other national policies/plans and priorities.
Key Indicators
- Population and Demographic Characteristics
- Functional Difficulty
- Education Characteristics
- Labour Force
- Fertility
- Housing/Household Characteristics
- Water, Sanitation & Hygiene
Key Reports
Data Tables
Thematic Reports
Background Information
Sampling Design
-
Used a stratified, two-stage cluster sampling method, with a third stage in very large CUs (Enumeration Areas selected within the sample CUs).
-
Produced 43 strata, 22 provinces by urban/rural (National Capital District has only urban areas).
-
Allocation was done proportionately according to size (in terms of the number of households).
-
Thus, 335 CUs / clusters were selected in the first- stage while a fixed number of 15 households per cluster were selected at the second stage resulting to a total sample size of 5,025 households.
Questions & Questionnaire Design
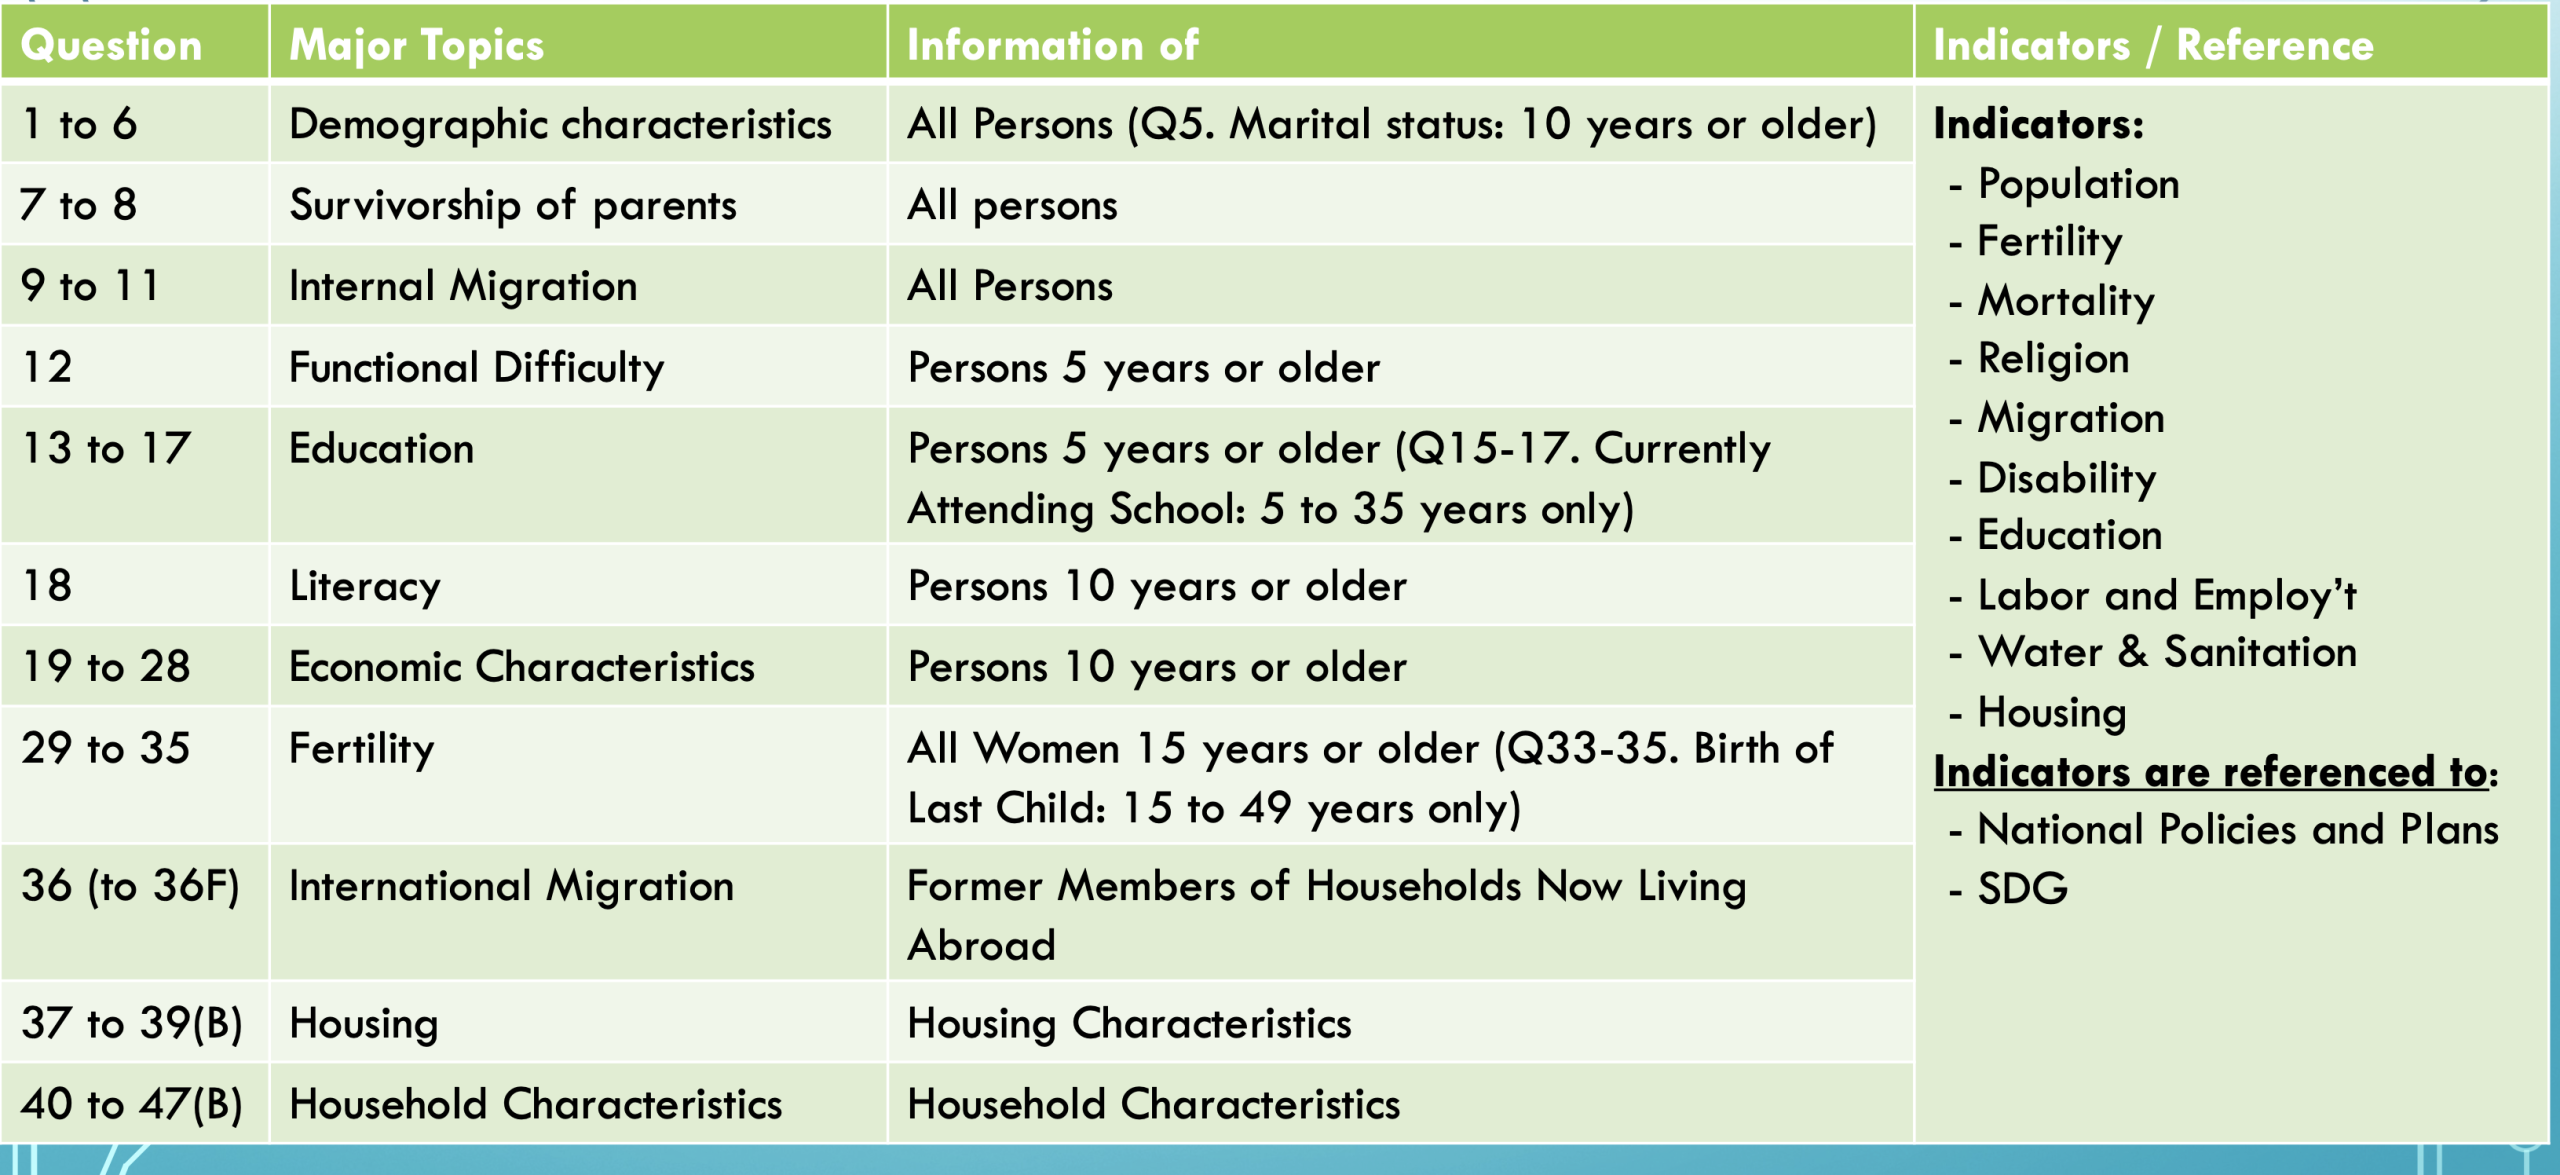
- Survey Solutions was used to carry out the CAPI data collection.
DATA COLLECTION METHOD
- Mixed (2) mode data collection approach
- Collection of Listing data using pen-and-paper- interview (PAPI) approach
- Collections of SDES data using:
- Computer-Assisted-Personal-Interview (CAPI) approach – use of tablets (recommended)
- Allot questionnaires for Paper-and-Pen- Interview (extreme cases)
- 452 tablets procured for the CAPI approach
TRAINING OF FIELD STAFF
- Training strategy – 3 tiers;
- Training of Master Trainers at Port Moresby, 6 days
- Training of Provincial Trainers at Port Moresby, 11 days
- Training of interviewers and supervisors in provinces, 10 days
- 3rd Tier training consisted of 6 days training on concepts and definitions, 2 days on use of tablets, and 2 days for Supervisors roles and responsibilities
- Training consisted of understanding data collection concepts through paper-based approach, then CAPI approach; Methods of sample households selection; and Classroom and outdoor practical sessions
- Total of 500 personnel were trained including reserves
FIELD WORK – DATA COLLECTION
- Data collection was completed in 2 months (May to June 2022)
- It was carried out by 107 teams, each consisted of 3 interviewers and 1 supervisor. Total of 400 enumerators and supervisors were involved
- Monitoring of field work (call center and monitor/s assigned in each province)
- Monitoring of data collection through a custom developed dashboard
Disability in PNG: key findings of the 2022 SDES
Disability in Papua New Guinea: Key Findings from the 2022 SDES and Policy Priorities
Three headline numbers to remember
4%
of the population have disabilities
15%
of households include a person with disability
70%
of persons with disabilities face multiple, overlapping disadvantages
Why this matters
The 2022 Socio-Demographic and Economic Survey (SDES) is the first nationally representative dataset in Papua New Guinea (PNG) to measure disability using the Washington Group short set of questions on difficulty with seeing, hearing, walking, remembering, self-care, and communicating. The results show that disability in PNG is not only a health issue: it is closely tied to weaker schooling, harder access to work, and poorer living conditions at home.
Key Findings
- Disability reaches into many households.
- 4% of Papua New Guineans aged 5 and above are persons with disability.
- 15% of households include at least one person with disability.
- Prevalence rises sharply with age, reaching 22% among persons aged 60 and above.
- Children with disabilities are being left behind.
- Adult literacy: persons with disabilities sit 17 percentage points behind everyone else (70% versus 87%).
- Primary school attendance gap: 30 percentage points (41% versus 71%).
- Secondary school attendance gap: 16 percentage points (22% versus 38%).
- Children with disabilities aged 6 to 18 years old are more than twice as likely to be out of school as other children.
- Disability is associated with poorer employment outcomes.
- Employment-to-population rate: persons with disabilities 46% versus others 51%. The disability gap remains statistically significant once we control for age, sex, education, and location.
- When accounting for various factors, the employment gap is about 14 percentage points, meaning persons with disabilities who are part of the labour force are 14 points less likely to be employed than otherwise-similar peers once age, sex, education, location, and province are accounted for. This gap is three times larger than the descriptive figure, because subsistence work flatters the simple comparison.
- Persons with disabilities are concentrated in subsistence agriculture and underrepresented in industry and services.
- Among employed persons with disabilities, 43.0 per cent are wage and salary workers, against 55.1 per cent for other employed persons.
- Disability and poverty push against each other from both sides.
- Households with a person with disability show worse basic living conditions: more crowded dwellings, greater reliance on polluting cooking fuels, poorer access to safe drinking water, and lower housing quality.
- 70% of persons with disabilities face multiple, overlapping disadvantages across education, work, and household conditions, compared with 29% for other persons.
- Disability is strongly linked with lower education, lower employment, and poorer housing and living conditions at home.
What should be prioritized?
Immediate (2026-2027)
✓ Operationalize the Disability Services Act 2025 by mainstreaming disability equity across health, education, justice, employment, and social protection services, with DfCDR as the lead coordinator.
✓ Anchor disability-disaggregated monitoring in the Disability Knowledge Hub and the Disability Data System concept under the National Statistical Information Framework (NSIF), so a single coordinated system, not scattered dashboards, carries the data forward.
✓ Use the SDES findings to underwrite PNG’s next CRPD reporting cycle.
Medium Term (2027-2030)
✓ Expand inclusive education through teacher training, accessible schools, and assistive devices.
✓ Improve pathways from school to work for persons with disabilities.
✓ Promote reasonable accommodation in employment.
Long Term
✓ Build a sustainable national disability data system, connecting survey evidence to the Disability Knowledge Hub.
✓ Strengthen administrative data with a disability marker in health, education, labour, and social-protection records.
✓ Integrate disability inclusion into sector plans, budgets, and SDG monitoring.
✓ Regularly collect Washington Group disability data in national surveys and censuses.
Key Message
The biggest disability gaps in PNG are in education. Children with disabilities are significantly less likely to attend school, which contributes to lower literacy, weaker employment outcomes, and higher vulnerability later in life. Closing these education gaps offers the greatest opportunity for improving inclusion and for realising the objectives of the Disability Services Act 2025.
Last updated 17 October 2026